Treemap
Treemaps show part-to-whole relationships by dividing a space into rectangles, where each rectangle's size corresponds to its proportional value within the whole. Treemaps make it easy to compare the relative weight of categories at a glance.
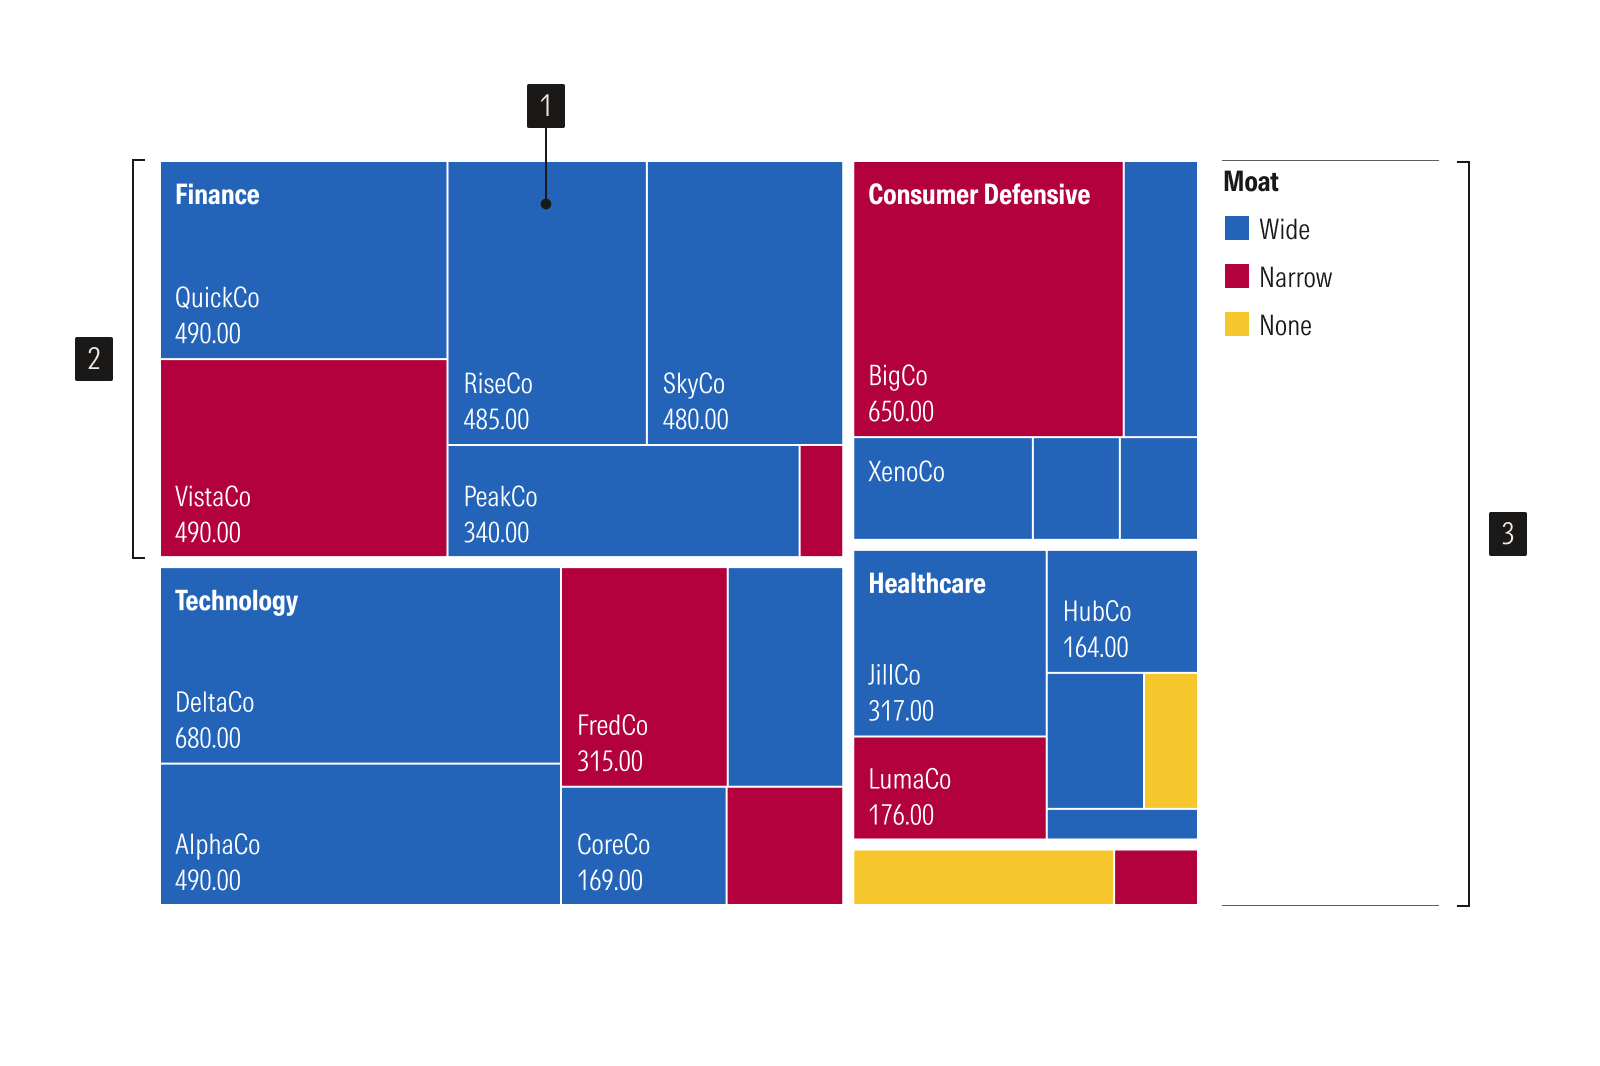
- Rectangle represents the area of single data value.
- Category groups related tiles together such as sector or region.
- Legend identifies data categories.
Usage
Use when:
- Showing parts of a whole across one or more levels of hierarchy.
- Fitting many categories into limited space, where a pie or bar chart would overflow.
- Spotting which categories dominate the total at a glance.
Avoid when:
- Precise value comparisons or ranking are required. Use a bar chart since length is easier to read than area.
- Hierarchical relationships are not important. Use a bar chart, table or donut chart instead.
- Tracking change over time. Use a line chart.
Best Practices
- Limit the total number of categories and nesting levels, to design for readability, not density.
- Group small or minor categories into an "Other" rectangle rather than overcrowding the area with thin divisions.
- Prioritize labels for larger rectangles and provide additional details through tooltips or interactions.
- Use high contrast label text on colored rectangle backgrounds for accessibility.
Usage
Packages
Technical documentation and usage examples are available in Storybook.
Package | Storybook |
|---|---|
@mc/treemap |