Waterfall
Waterfall charts show how an initial value increases or decreases through a series of positive and negative contributions to arrive at a final value. Waterfall charts make it easy to understand what is driving change between two points.
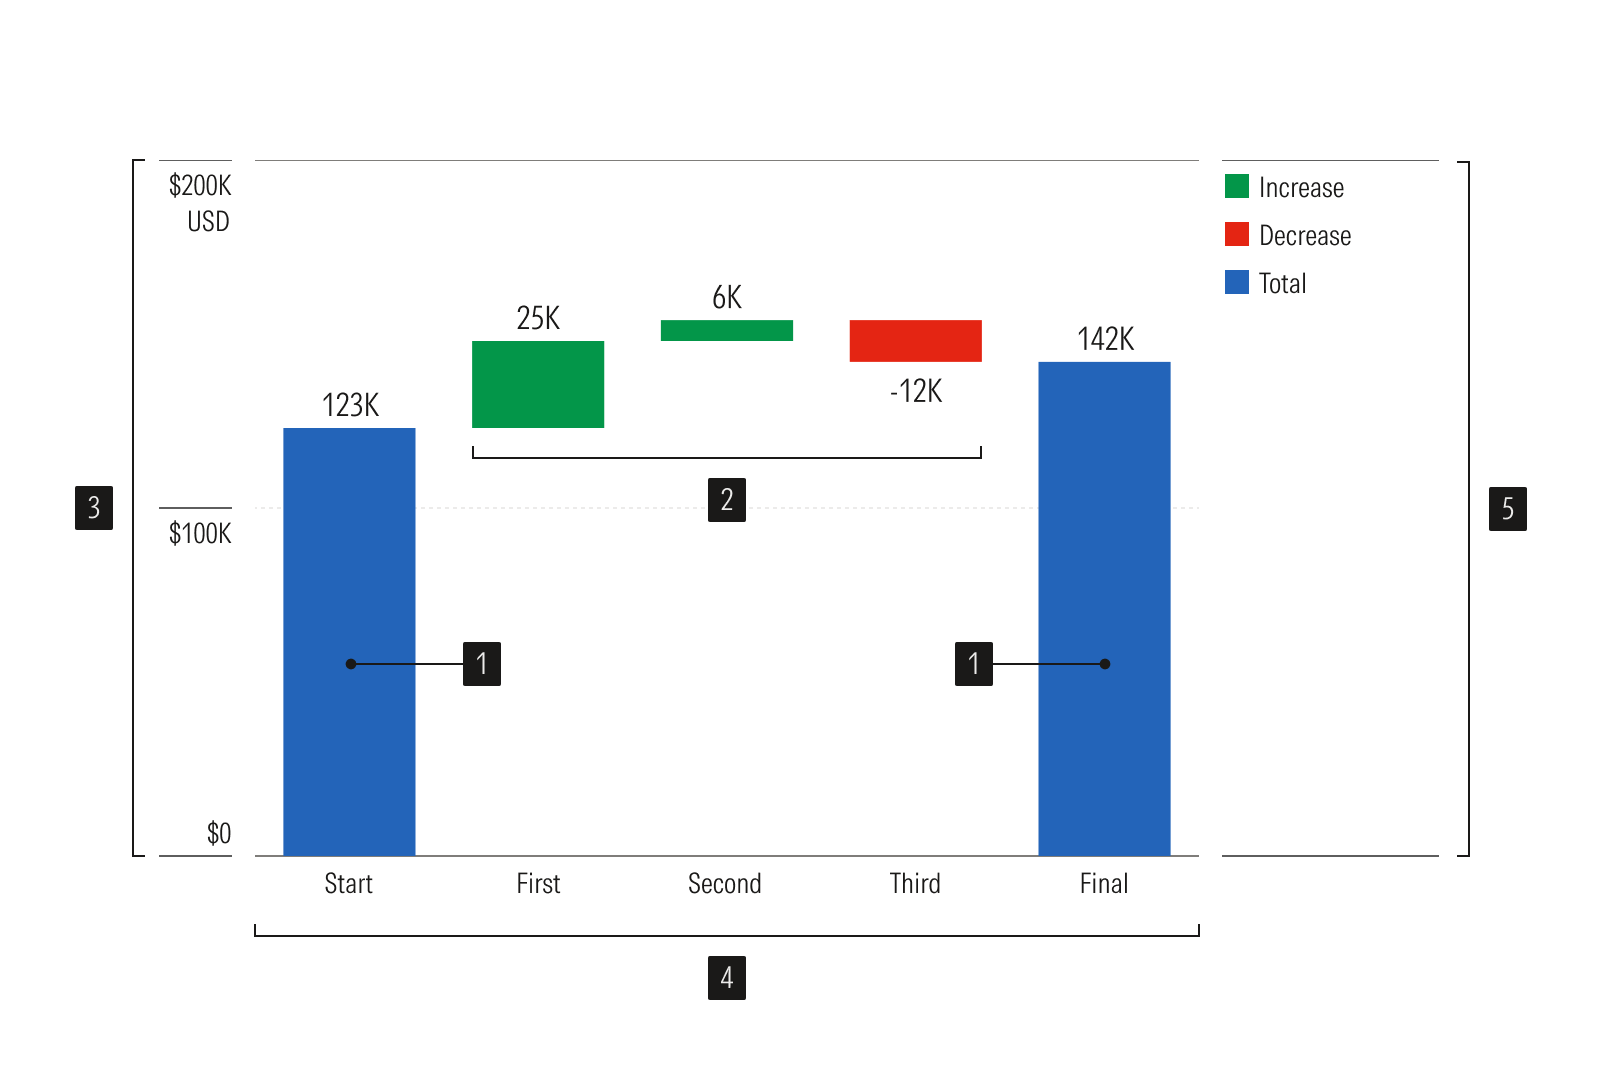
- First and last bar plots represent beginning and end values based on zero.
- Middle bar plots represent increased and decreased values positioned relative to previous bars.
- Y-axis is a vertical axis that uses a linear scale.
- X-axis is a horizontal axis that uses a categorical scale.
- Legend identifies data categories.
Usage
Use when:
- Visualizing the underlying drivers of change to a value in sequence.
- Explain how a start value becomes an end value via a sequence of additions/subtractions.
- Show cumulative composition in sequence, not just change over time.
Avoid when:
- Categories are independent and don't build on one another. Use a vertical bar chart.
- Showing parts of a whole at a single point in time. Use a donut chart or a treemap.
- Tracking a trend across many data points, or where interim volatility matters. Use a line chart.
Usage
Packages
Technical documentation and usage examples are available in Storybook.
Package | Storybook |
|---|---|
@mc/waterfall |